The same distance covered as last year (about 3700kms, almost 4000 including the small trips at destinations)
No drop off in range compared to identical trips done in the previous years
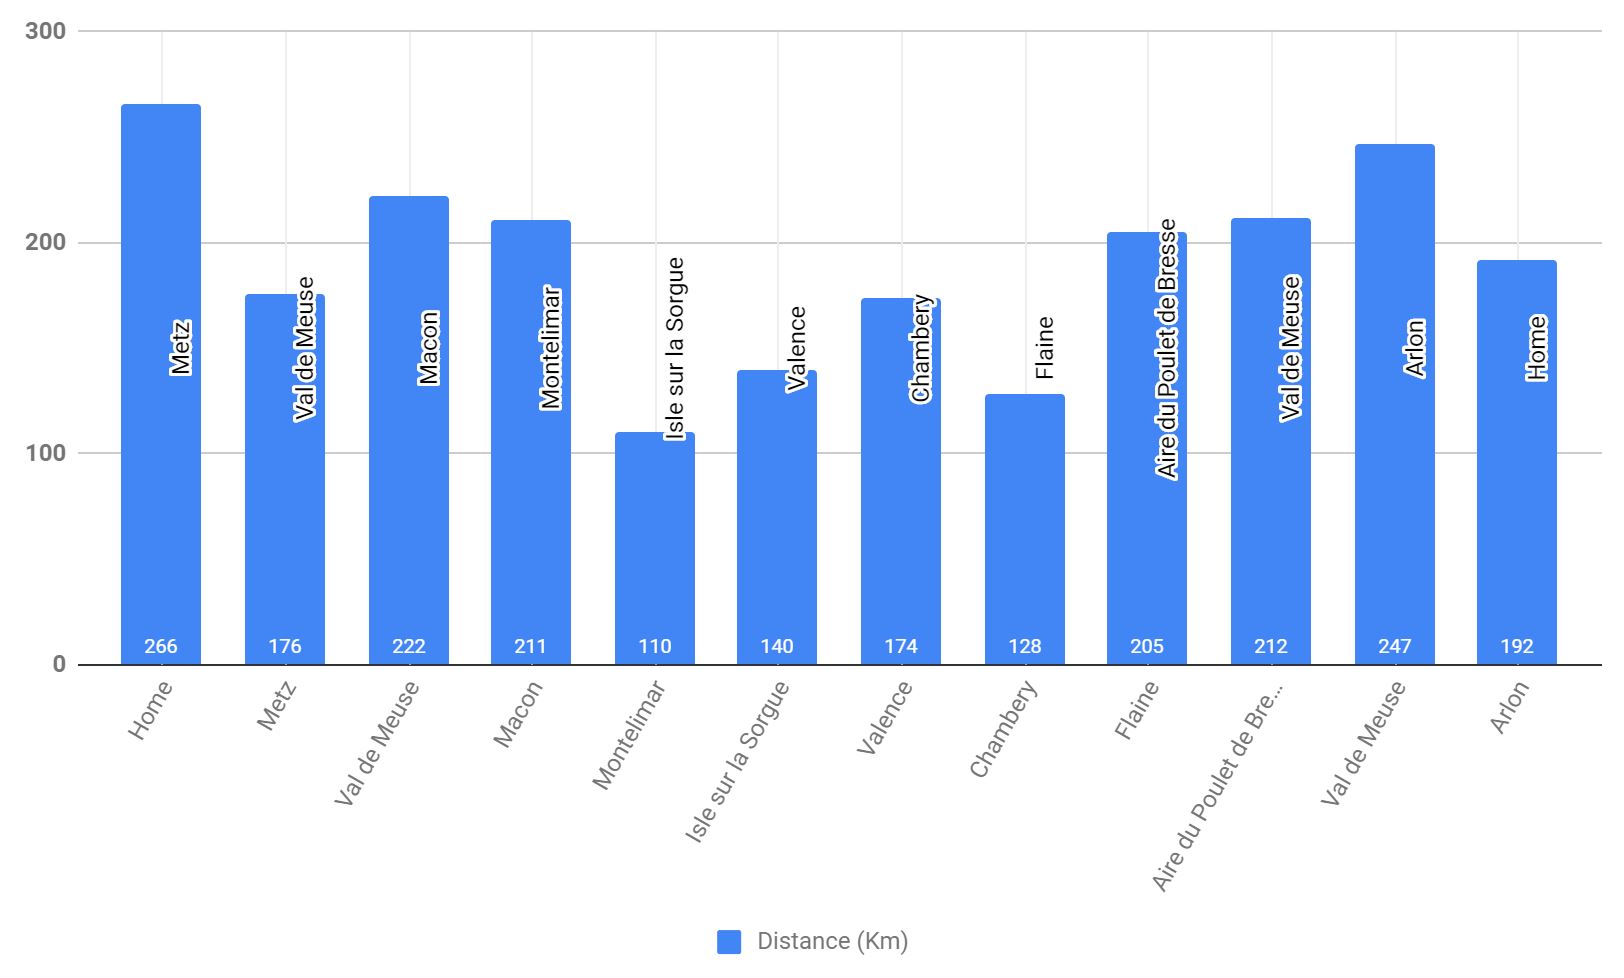
I can confidently plan segments of 250+ kms. In fact, 8 out of 18 segments during this road trip were over 230km
Will probably stay away from Southern France for a while after some horrific traffic jams between Lyon and Valence
The number of Tesla Superchargers increasing faster than the combined need of Tesla + non-Tesla cars. Never had to wait in line and always found at least 2 free spots
The Superchargers network in Germany is insane
Brussels to Provence, then Brussels to Austria8/18 segments over 230 kmStill happy
Two trips instead of one: to Southern France and to Austria
New distance record: 280.3km from Brussels to Metz
New range record: only 22kms left in the tank before supercharging
No incidents this time 🙂
Brussels to Provence, then Brussels to AustriaThe first segment is the biggest – 280.3km. 3784kms in total, excluding the short trips at the destination280.3kms in one go; still 56km left in the tank…No risk, no fun 😈Before the final leg
The annual road trip with my Model S is done. Over 2000km and 10 supercharging stops – this roadtrip covered only two countries this time – Belgium and France:
Brussels – Provence – French Alps – Brussels
Some notes along the way:
for the first time since I bough my Model S, I noticed a queue at one supercharger. A good sign, I suppose (Tesla fleet increasing), but also a worrying one – the supercharging network must be expanded quicker so that it doesn’t become a victim of its own success
charging tip: if you use a power extender, make sure you unroll the cord. Leaving it rolled while you charge will make the extender’s thermal protection kick in, especially under the Provence summer heat (the extender will also have a restart button which you can use after it cools down).
another charging tip: while supercharging I started to turn the cabin climate off. Walk away from the car, let it supercharge, and then, a few minutes before I go, stop charging and then cool the car. This way I avoid putting pressure on the cooling system; as I learned the hard way last year, there are parts of it that cool both the battery and the cabin.
uphill roads will eat up the range pretty quickly. For instance, an elevation difference of 1200m over 21km ate up about 90km of range. Doing the same trip with an empty car doesn’t change things too much.
the increase in speed will eat up the range in a non-linear way. An average of 110-115km/h will keep the ‘consumption’ under 180 Wh/km, even with a full car. Going up to 130-135km will take that up to over 220 Wh/km. Non-linear, as I said: the speed goes only 17% up, but the consumption increases by 22%
the only incident during this road trip: the driver’s door handle is now stuck half-open and I can no longer open the door from the outside. The problem is not uncommon apparently:
Tesla Model S doors, in fact all Tesla doors, are opened electro-mechanically. When you pull the door handle to unlock the door you are not mechanically releasing the door, you are actually making the door handle close a micro-switch which then triggers an electronic component to release the door. What can happen is one of the microswitches (highlighted on the picture) or the wiring coming out of it can fail and the signal either doesn’t get created or doesn’t get transmitted to where its needed.