Tesla road trip 2019

Written on 1 September 2019, 12:00am

Tagged with: ,

Writing this post some months after the trip which happened in August 2019

2800km through France, Italy, Switzerland, Austria and Germany
The trip segments – 2773 km in total

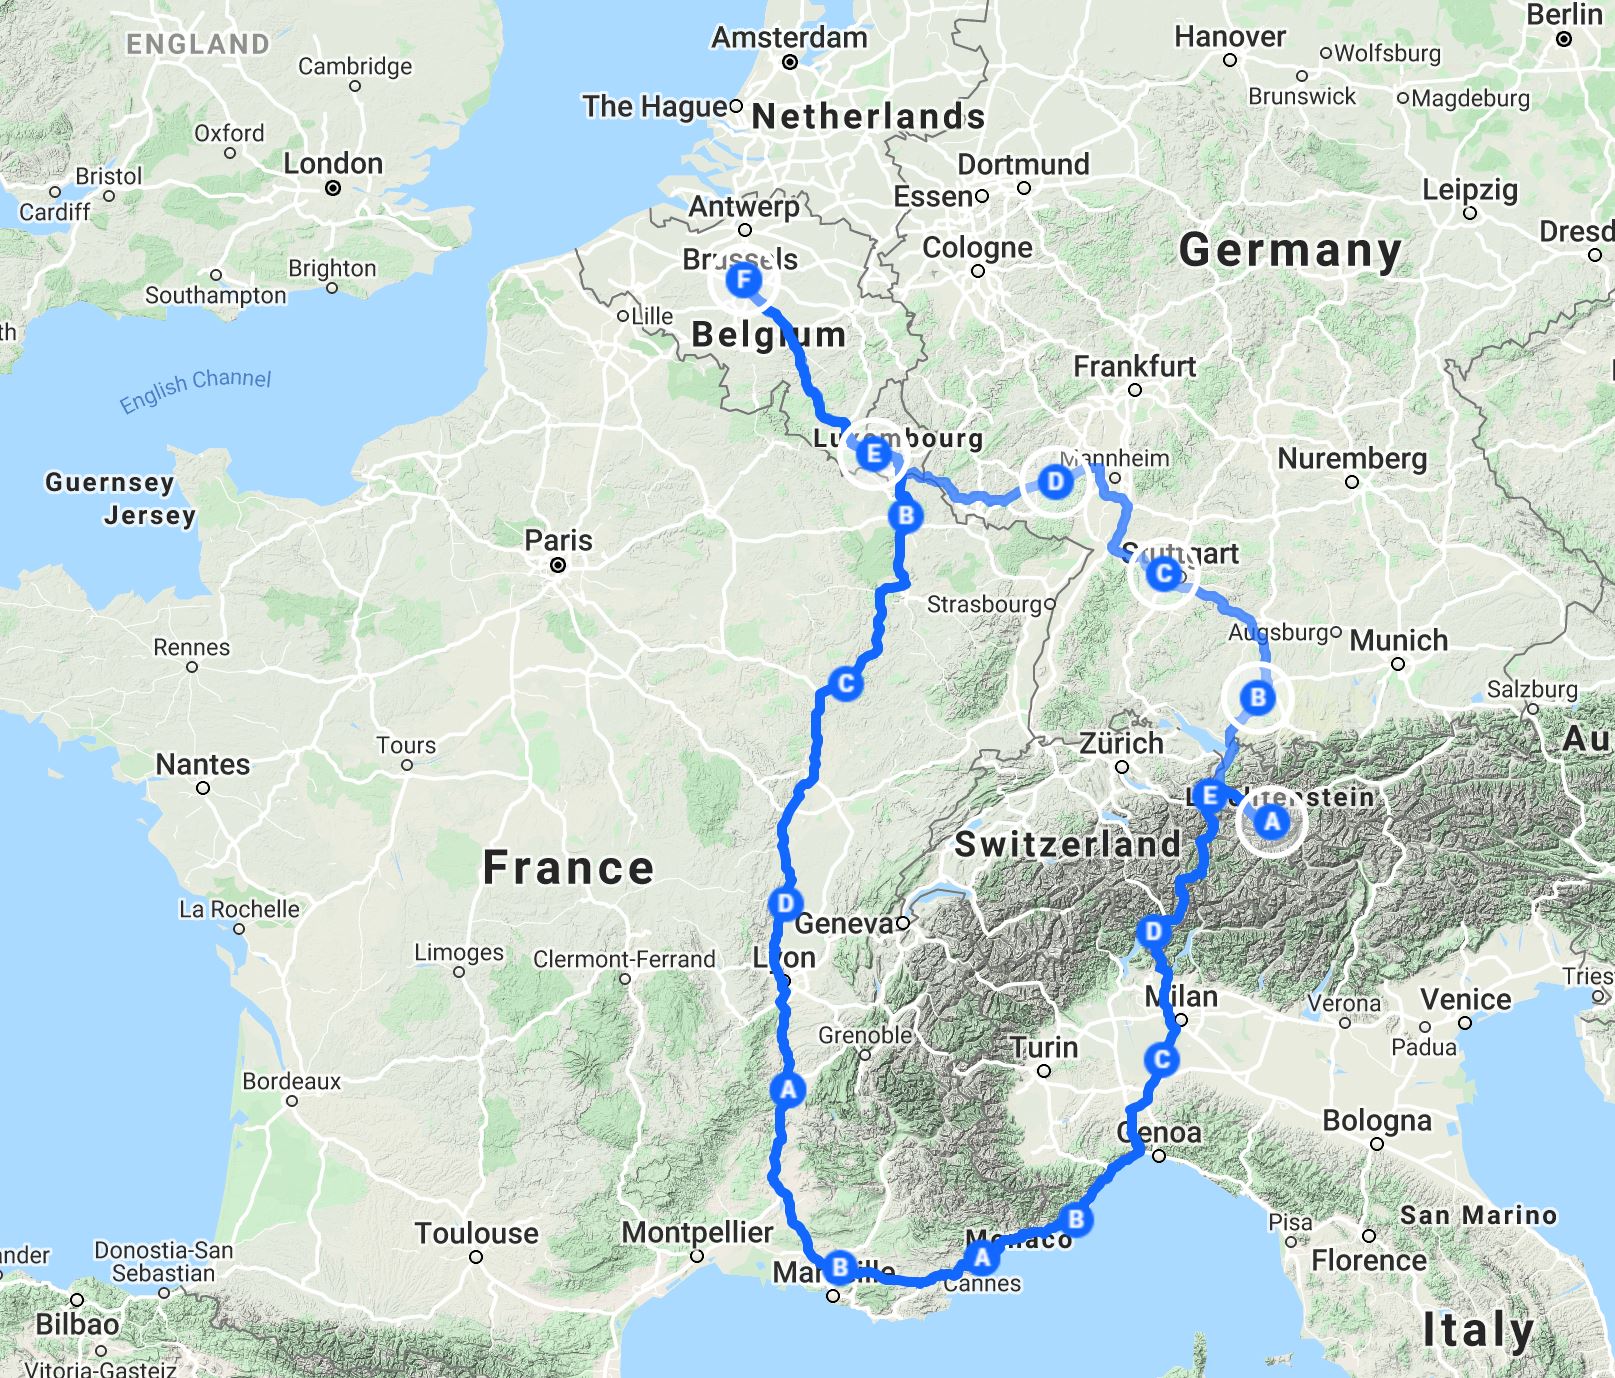
The road trip was mostly ruined by a faulty piece – the chiller – which led to the AC not working for a few hundred kilometers in Southern France.

By ‘reduced’ it meant ‘not working’

Here are some notes that I sent to Tesla back then:

There are a number of shortcomings in the way Tesla provides support, I am detailing them below:

1) the alert message was simply wrong (the AC was not ‘reduced’ but simply not working anymore)

2) the alert message does not provide any indication on the next steps I could take (like the ones communicated on the phone 16 hours later). Why not put these troubleshooting steps on the console when the alert appears on the screen? Or, even better, send a ranger my way?

3) the waiting times for the call center are simply ridiculous. On 12th August I tried to reach the Tesla roadside assistance from 16:00 to 19:30, without any luck. This is simply unacceptable to me, since I had an emergency

4) the instructions received by phone are contradicting the ones from the Service Center. Not only they were wrong, but they put into danger my safety (by encouraging me to drive along in a potentially unsafe car) as well as the battery life (the Aix en Provence SC said that the battery could be irremediably damaged by continuing to drive)

5) Tesla mobility solutions are ineffective and inflexible. I understand that finding a loaner at 17:30 on the day before a national holiday in France is not easy, but Tesla should be more flexible and better prepared for such cases

6) the Tesla parts distribution network has a lot of room for improvement. Overnight delivery in Europe should be a lot easier than in the US, and in the worst case, you should have a clear indication when an ordered piece will arrive at the SC

7) your European branch seems to be significantly understaffed. I am talking about 1) call center staff 2) SC technical staff (it took almost 4 hours to diagnose the problem) and 3) SC customer support staff (the SC manager told me that he has very few people who could help me with the issue).

In the end, after more than two days of waiting and uncertainty, the Aix Service Center found a solution to my problem:

  • either the faulty piece ordered on 14th of August PM arrived on 16th of August AM from the Netherlands (15th of August is a bank holiday)
  • or (more likely if you ask me), the SC simply replaced the faulty piece in my car with a working one from a loaner, while waiting for the original piece to be delivered from the Netherlands.
One of these is the chiller

CL draws reloaded

Written on 14 March 2019, 04:25pm

Tagged with: , , ,

You have 8 teams. They will be drawn one against each other, so 4 pairs in total.

Question 1: how many distinct pair sets are possible?

105. I got to this number after running a large number of simulations. Then I did a little bit of research and I also found the formula:

k=4

Question 2: if 4 of the 8 teams are from England, what is the probability that all 4 of them will be drawn together?

Again, after analyzing the 105 distinct pair sets, I found that only 9 of them have all-English pairs. The full probability set is:

  • two English pairs: 9/105 or 8.57%
  • exactly one English pair: 72/105 or 68.57%
  • no English pair: 24/105 or 22.86%

UEFA CL draw probabilities – 2018 edition

Written on 19 December 2018, 06:44pm

Tagged with: , , , ,

This is a follow up to https://colorblindprogramming.com/round-probabilities-before. Last year I stopped after discovering that the only correct way to calculate the odds is to look at the probability trees. This year I took this one step forward and created a script that would calculate the correct probabilities. I intend to reuse this script for the future draws, and a year it’s a long time for my memory so I am adding some notes here.

The incorrect approach: the big-bowl

The first approach last year was to calculate all the possible pairs, eliminate the invalid ones and then calculate the associated percentages for each pair. In hindsight, this approach was obviously wrong, because it doesn’t replicate the actual draw. This approach would only be accurate if the draw consisted of a single draw – from a very big bowl of all the valid options. This is obviously not how the actual draw works, so even if the final numbers were pretty close to the correct ones, it was not the correct approach.  

The correct approach, using conditional probabilities

The correct way to look at this is by understanding that we are talking about dependent events. Each draw depends on the actual result of the previous draw. It’s identical to this process, beautifully explained on MathIsFun.com:

So how do we actually do it?

There are two approaches:
The first one is a bit more complicated and implies creating the tree above for the 16 teams and 16 steps (each team pick is a step). It has the advantage of producing accurate results, but it’s a bit more difficult to implement.
The second one consists of simulating the draw process and repeating it a lot of times. I found this approach easier, here is the pseudo-code of the draw process:

  1. for each unseeded team
  2. if there is a mandatory draw (starting from the 5th unseeded team)
    1. then automatically create the pair and add it to the draw
  3. otherwise, pick a random unseeded team
    1. get the list of available seeded teams
    2. randomly pick a seeded team from the list above
    3. add pair to the draw
  4. end

Repeating this process a few millions of times would lead to millions of possible draws, and based on that we can calculate the percentages.

But there are 2 catches:
1. Checking both sides of the draw. Have a look at the step 2 above, checking if there is a mandatory draw: let’s say you are left with 4 unseeded teams and 4 seeded teams. It’s not enough to look at the unseeded teams options, you also need to look the other way around. Example:
Unseeded teams: Liverpool, United, Shalke, Lyon
Seeded teams: PSG, City, Real, Barcelona
Liverpool has 2 options, United 3, Shalke 4 and Lyon 2. But if you randomly pick Shalke and you pair it with any of PSG, Real or Barcelona, then you leave an impossible draw for City (which cannot be drawn against any of the 3 English teams left). So the solution is to count the number of options for both unseeded and seeded teams. If there is a single option, pick it.

2. Go back if needed. Even with the above safety mechanism in place things can still go wrong. Example:
Unseeded teams: Roma, Liverpool, Shalke, Lyon
Seeded teams: Porto, Barcelona, PSG, City
Options for the unseeded teams: Rome -4, Liverpool -2, Shalke -4, Lyon -2.
Options for the seeded teams: Porto -3, Barcelona -4, PSG -2, City -2. 
The safety mechanism above (counting the number of options for both seeded and unseeded teams) tells us that everything is fine. So we go ahead and pair Rome with Porto. We are now left with:
Unseeded: Liverpool -1, Shalke -3, Lyon -1
Seeded: Barcelona -3, PSG -1, City -1.
The problem is that both PSG and City have an option, and that option is Shalke. So this leads to an impossible draw, so the solution in this case is to go back one step and pick another draw instead of Roma v Porto.
According to my calculations this could happen in about 0.4% of cases, and I am really curious how UEFA would handle it if it happened on stage. In the scenario above, if Roma was selected as unseeded team, I expect that the computer will only allow PSG and City to be one of the seeded teams, but I am really curious to hear the hosts explanation about this constraint (since both Porto and Barcelona are, at first sight, also valid options for Roma) 🙂

Using the algorithm above, I ran the simulation 2 million times. These are the results:

Checking the results

The nice thing about being both a geek and a football lover is that you get to know smart persons at the intersection of science and football. Two of them are Julien Guyon and Emmanuel Syrmoudis. They also spent time thinking about this topic. Julien came up with a great explanation of the draw process and probabilities, while Emmanuel went one step forward and actually created an interactive draw simulator.  

My results come pretty close to theirs, so I’m quite confident that my method is decent enough. I plan to reuse it again next year and, perhaps, also try to create the actual probability tree to get the exact percentages.