UEFA CL round of 16: probabilities table before the draw
Written on 8 December 2017, 12:03am
Tagged with: football, probabilities, statistics
A post where football meets science again 🙂 This time, it’s about probabilities.
On 11 December 2017 the UEFA Champions League draw will take place. There will be 16 teams which will be drawn one against each other. There are some restrictions:
– 8 teams are seeded, the other 8 are unseeded. A seeded team can only be drawn against an unseeded team
– teams from the same country cannot be drawn against each other
– teams that already met in the previous round cannot be drawn against each other
Based on these elements, I wanted to calculate the associated probabilities, or other words to reveal the question marks in the matrix below:
![]()
(first column – seeded teams, first line – unseeded teams, greyed cells – teams cannot be drawn).
Try 1: Thursday night
I make a quick PHP script to calculate all the possible permutations (8!=40320), then I eliminate the invalid options and find that only 4238 permutations are possible. I count all the possible team pairings as below:

I calculate the associated percentage for each pair (example for Liverpool-Real it’s 799 out of 4238=18.85%) and, after half an hour spent choosing a color scheme, I put everything in the matrix:
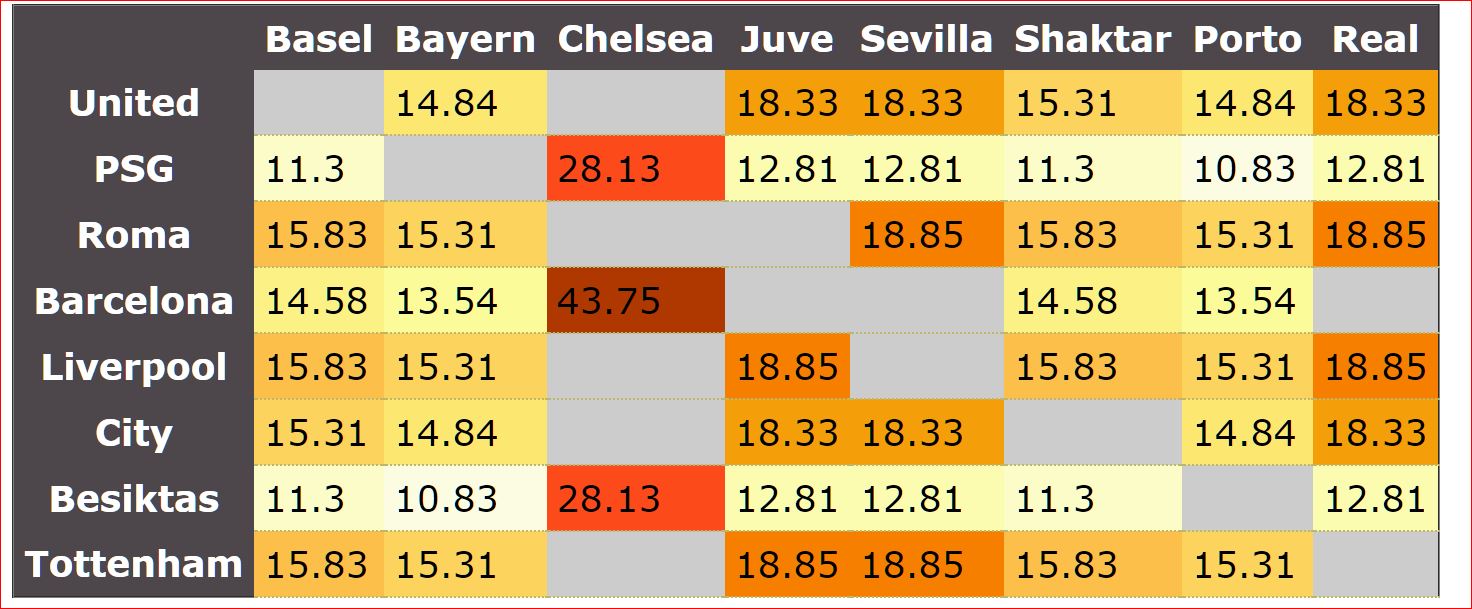
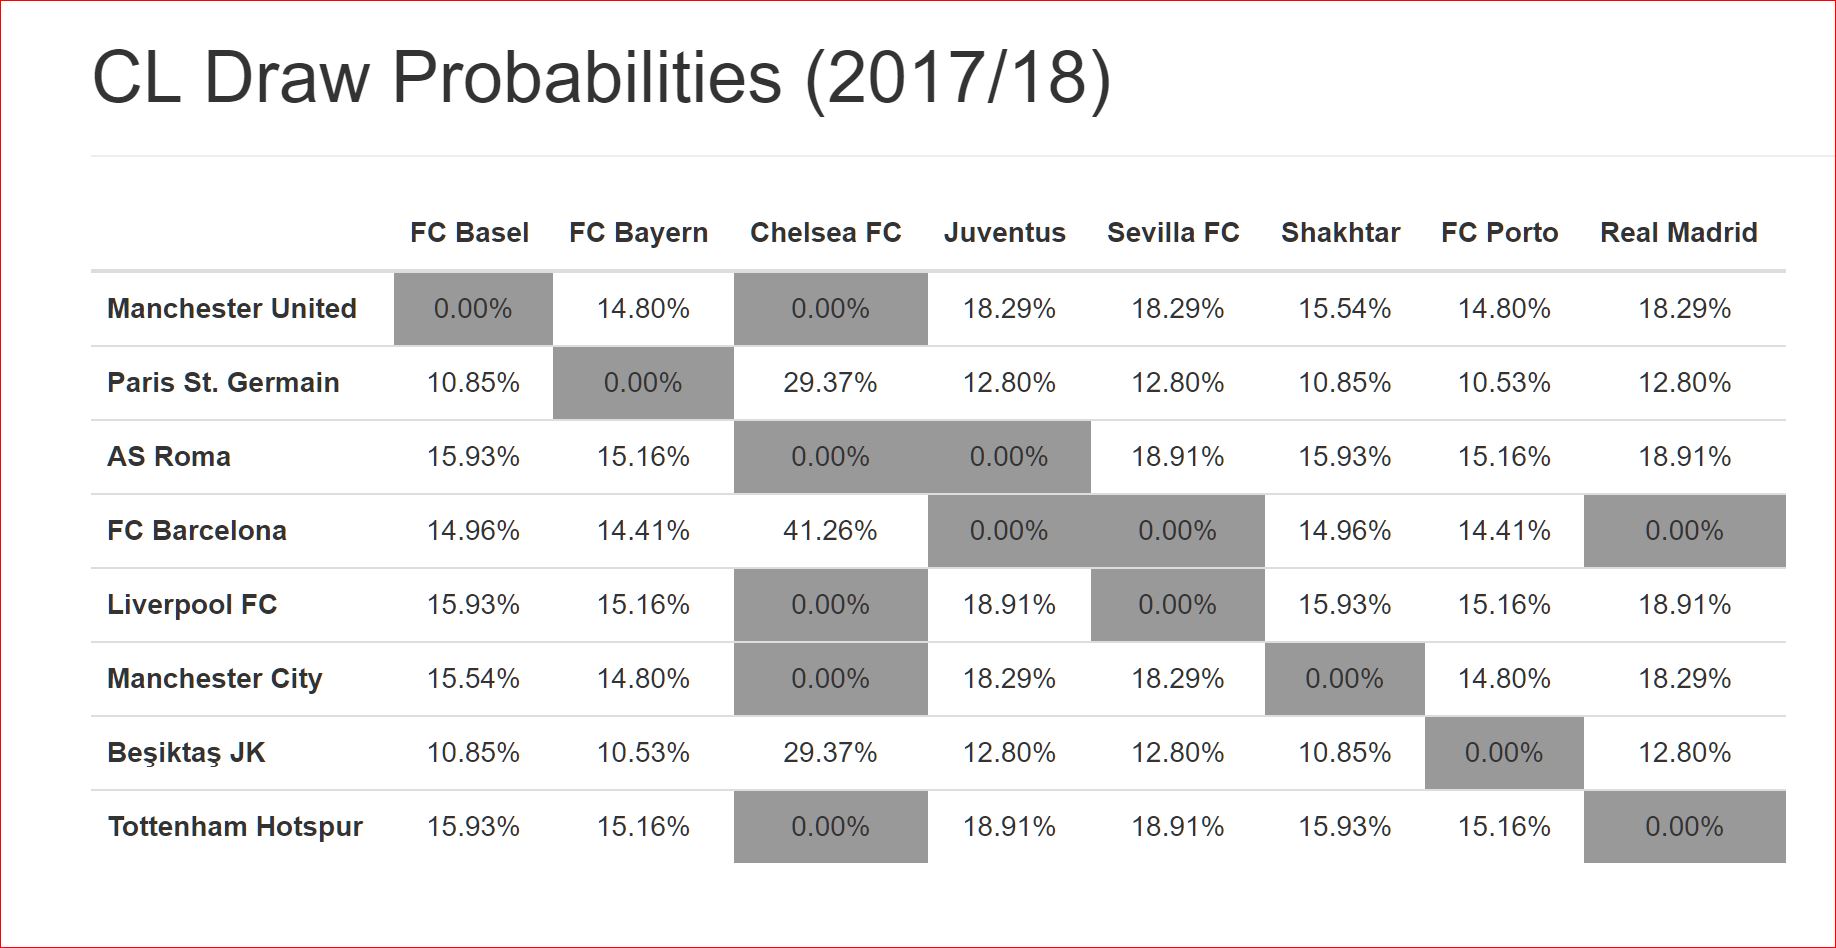
Then I realize that the numbers are slightly different from the ones circulated on social media:
Try 2: the entire weekend
I get a very nice explanation on Twitter from the author of the tool above:
You have to consider all possible ways this pairing can be drawn. Take a look and sorry for the handwriting: pic.twitter.com/9bMJD3aNWG
— eminga (@e_mi_nga) December 10, 2017
Then I start to realize that my approach was incorrect.
In fact, my numbers were only valid if the draw process consisted of a single step – somebody picking up a random number from 1 to 4238 and then showing up the 8 pairings behind that number.
But in fact, the draw process consist of 8 steps or 8 events, each one depending on the previous one. We speak in this case of conditional probabilities, which are represented using a probability tree. The probability tree for a subset of 6 teams looks like this:
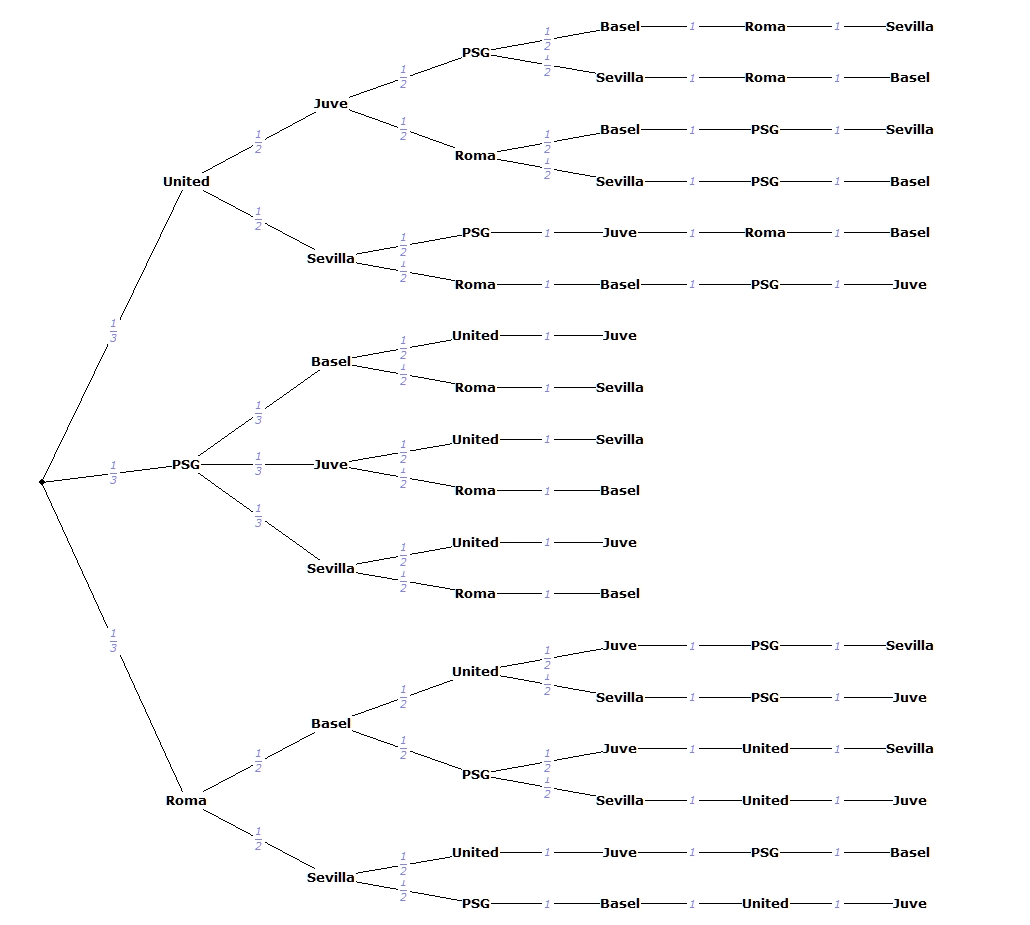
And indeed, the tree simulates the real draw process and reveals the same numbers as the ‘official’ ones:

I finally get it, @e_mi_nga ! 💡
It's because the events are dependent => conditional probabilities => tree diagrams.
The 33% percentage would apply if somebody would randomly pick one of the 3 possible pairings. But the draw consists of 3 dependent events.
Thank you all! pic.twitter.com/pRmLS1hwPw— Dorin Moise (@dorinmoise) December 10, 2017
Since the draw is in less than 12 hours, I have no time to make another script that generates the full tree (that would also be too big to put in a picture). But I trust the numbers from https://eminga.github.io/cldraw/ are correct 🙂
Champions League Draw. #UCL pic.twitter.com/y25FIRmscu
— julian (@bimbeshausen) December 6, 2017
Links:
https://en.wikipedia.org/wiki/Tree_diagram_(probability_theory)
https://www.everythingmaths.co.za/read/maths/grade-11/probability/10-probability-02
https://kera.name/treediag/
http://www.bbc.co.uk/schools/gcsebitesize/maths/statistics/probabilityhirev1.shtml
Written by Dorin Moise (Published articles: 294)
Comments (1)